Marginal Emissions
Contents
Marginal Emissions#
Exploring the functionality of NEMED to extract regional marginal emitters from price setting and generator emissions data
Data Preparation#
Import Packages#
Show code cell content
import nemed

import pandas as pd
# To generate plots shown
import plotly.graph_objects as go
import plotly.express as px
import string

# Open plot in browser (optional)
import plotly.io as pio
pio.renderers.default = "browser"
Processing Marginal Emissions Data#
Regional Marginal Emissions can be extracted in NEMED using get_marginal_emissions. The following inputs must be specified:
start_timedefine the start of the historical period to collect data for. Must be in the format: “yyyy/mm/dd HH:MM”end_timedefine the end of the historical period to collect data for. Must be in the format: “yyyy/mm/dd HH:MM”cachespecify the local file directory to temporarily store downloaded files
The returned dataframe will contain timeseries data with columns:
Column |
Type |
Description |
|---|---|---|
Time |
datetime |
Timestamp reported as end of dispatch interval. |
Region |
string |
The NEM region corresponding to the marginal emitter data. |
Intensity_Index |
float |
The intensity index [tCO2e/MWh] (as by weighted contributions) of the price-setting generators. |
DUID |
string |
Unit identifier of the generator with the largest contribution on the margin for that Time-Region. |
CO2E_ENERGY_SOURCE |
string |
Unit energy source with the largest contribution on the margin for that Time-Region. |
The simpliest way to collect emissions data is:
Note
Extracting 1 month of marginal emissions data was found to take approx. 2 minutes in testing.
Extracting 1 year of marginal emissions data was found to take approx. 30 minutes. Cached files amount to 3 GB.
result = nemed.get_marginal_emissions(start_time="2021/01/01 00:00",
                                      end_time="2022/01/01 00:00",
                                      cache="E:/TEMPCACHE2/")
Show code cell output
WARNING: Warning: Gen_info table only has most recent NEM registration and exemption list. Does not account for retired generators
INFO: Processing Price Setter Files...
0it [00:00, ?it/s]
Reading selected 366 JSON files to pandas, of cached files
INFO: Loading Cached Price Setter Files...
100%|██████████| 366/366 [01:42<00:00, 3.56it/s]
result.head()
| Time | Region | Intensity_Index | DUID | CO2E_ENERGY_SOURCE | |
|---|---|---|---|---|---|
| 0 | 2021-01-01 00:05:00 | NSW1 | 0.908305 | VP6 | Black coal |
| 1 | 2021-01-01 00:05:00 | QLD1 | 0.855969 | VP6 | Black coal |
| 2 | 2021-01-01 00:05:00 | SA1 | 0.867177 | VP5 | Black coal |
| 3 | 2021-01-01 00:05:00 | TAS1 | 0.000000 | GORDON | Hydro |
| 4 | 2021-01-01 00:05:00 | VIC1 | 0.895716 | VP6 | Black coal |
Aggregate/Filter data#
Data retrieve from NEMED can be manually filtered. For example sorting by region we can produce…
result['Date'] = result['Time'].dt.date
result['Hour'] = result['Time'].dt.hour
result['Season'] = result['Time'].dt.month%12 // 3 +1
result['Season'].replace({1:'Summer', 2:'Autumn', 3:'Winter', 4:'Spring'}, inplace=True)
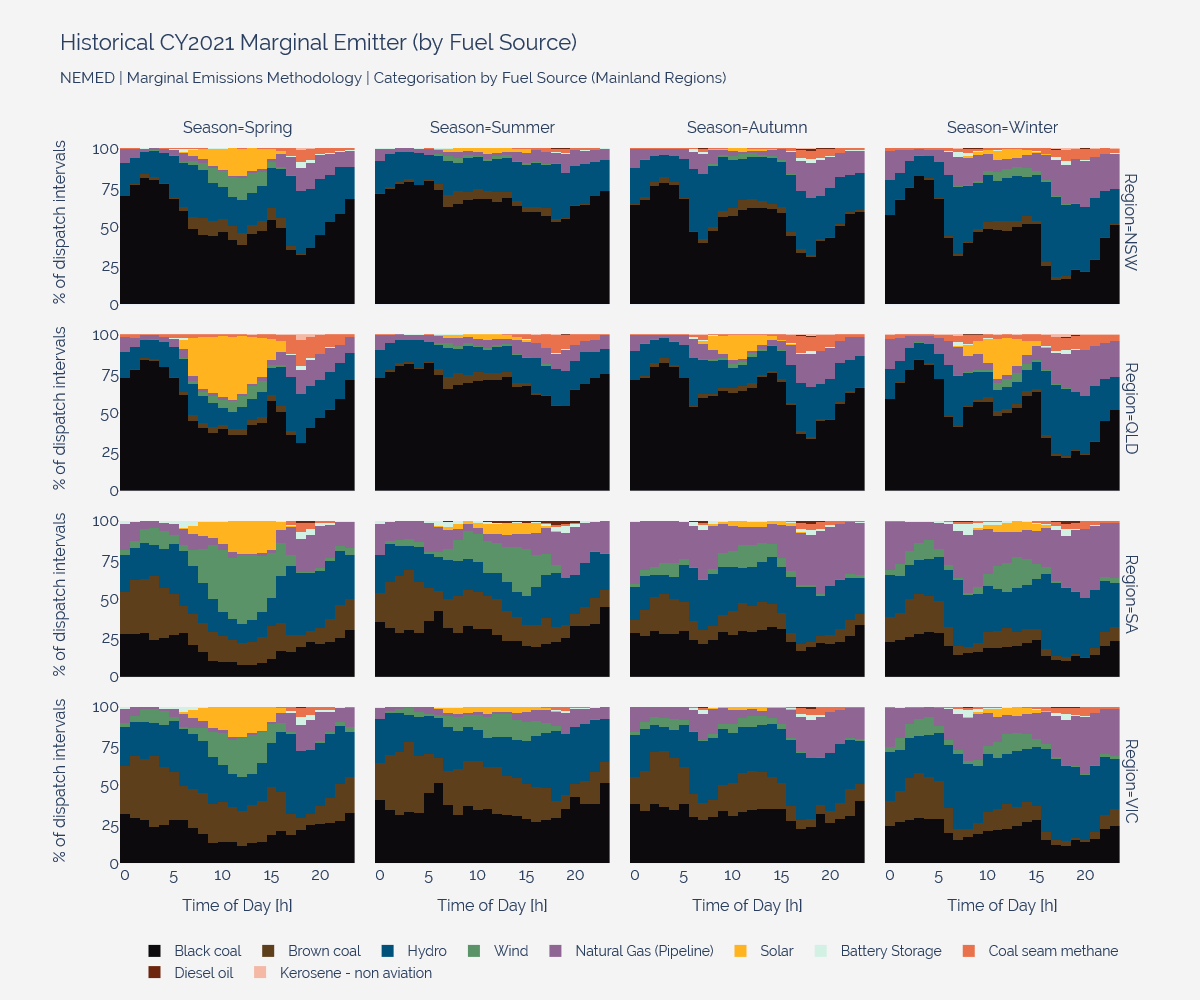
Example Chart 1#
Which fuel (generator) type is most often the marginal emitter?#
The below chart can be reproduced using the code below (toggle the cell to view)
result['Date'] = result['Time'].dt.date
result['Hour'] = result['Time'].dt.hour
result['Season'] = result['Time'].dt.month%12 // 3 +1
result['Season'].replace({1:'Summer', 2:'Autumn', 3:'Winter', 4:'Spring'}, inplace=True)
Show code cell content
def NORD_theme():
    plotly_NORD_theme = pio.templates["plotly_white"]
    plotly_NORD_theme.layout.plot_bgcolor = "#f4f4f5"
    plotly_NORD_theme.layout.paper_bgcolor = "#f4f4f5"
    plotly_NORD_theme.layout.xaxis.gridcolor = '#d8dee9'
    plotly_NORD_theme.layout.yaxis.gridcolor = '#d8dee9'
    return plotly_NORD_theme

def set_font_size(layout, font_size=16):
    layout['titlefont']['size'] = font_size + 4
    layout.legend['font']['size'] = font_size

    for ax in [item for item in layout if item.__contains__('xaxis')]:
        layout[ax].titlefont.size = font_size
        layout[ax].tickfont.size = font_size

    for ax in [item for item in layout if item.__contains__('yaxis')]:
        layout[ax].titlefont.size = font_size
        layout[ax].tickfont.size = font_size

def plot_marginal_fuelsrc(plt_df):
    df = plt_df[plt_df['Region']!="TAS1"].copy(deep=True)
    df['Region'] = df['Region'].str.rstrip(string.digits)
    # Chart
    fig = px.histogram(
        df,
        x="Hour",
        color="CO2E_ENERGY_SOURCE",
        facet_col="Season",
        facet_row="Region",
        barnorm="percent",
        category_orders={"Season":["Spring", "Summer", "Autumn", "Winter"]},
        height=1000,
        width=1200,
        color_discrete_sequence=['#0C0A0C','#5E3F1C','#00527A','#5A9367','#8F6593','#FFB41F','#D2F1E4','#E9724C',
                                 '#6D250D','#F4B8A4'])
    # Layout
    fig.update_layout(title=dict(text=f"Historical CY2021 Marginal Emitter (by Fuel Source)<br>"+\
                             "<sub>NEMED | Marginal Emissions Methodology | Categorisation by Fuel Source (Mainland Regions)</sub>",
                                 y=0.95),
                      template=NORD_theme(),
                      legend={'title':'', 'orientation':'h', 'xanchor': 'center', 'x': 0.5, 'y':-0.1},
                      margin=dict(l=120, r=60, t=140, b=60))

    # Axis Formatting
    fig.update_yaxes(title_text=None, mirror=True, showgrid=False)
    fig.update_yaxes(title="% of dispatch intervals", tickvals=[0,25,50,75,100], col=1,)
    fig.update_xaxes(mirror=True, showgrid=False)
    ax_time = dict(title_text="Time of Day [h]")
    fig.update_layout(xaxis=ax_time, xaxis2=ax_time, xaxis3=ax_time, xaxis4=ax_time)

    # Font Formatting
    FONT_SIZE = 16
    FONT_STYLE = "Raleway"
    fonts = dict(tickfont=dict(size=FONT_SIZE, family=FONT_STYLE),
                titlefont=dict(size=FONT_SIZE, family=FONT_STYLE))
    fig.update_layout(xaxis=fonts, xaxis2=fonts, xaxis3=fonts, xaxis4=fonts,
                      yaxis=fonts, yaxis5=fonts, yaxis9=fonts, yaxis13=fonts,
                      legend=dict(font=dict(size=FONT_SIZE-2, family=FONT_STYLE)),
                      title_font_family=FONT_STYLE,
                      title_font_size=22)
    fig.update_annotations(font=dict(size=FONT_SIZE, family=FONT_STYLE))
    return fig
fig = plot_marginal_fuelsrc(result)
fig.show()
Interactive Plot
Click the image to open the plot as an interactive plotly