Benchmark Results
Contents
Benchmark Results#
Comparing the results of NEMED to AEMO CDEII Reporting for Regional Sent-Out Generation, Total Emissions and Average Emissions Intensity
This page contains all region data for Sent-Out Generation, Total Emissions and Emissions Intensity comparisons between CDEII and NEMED.
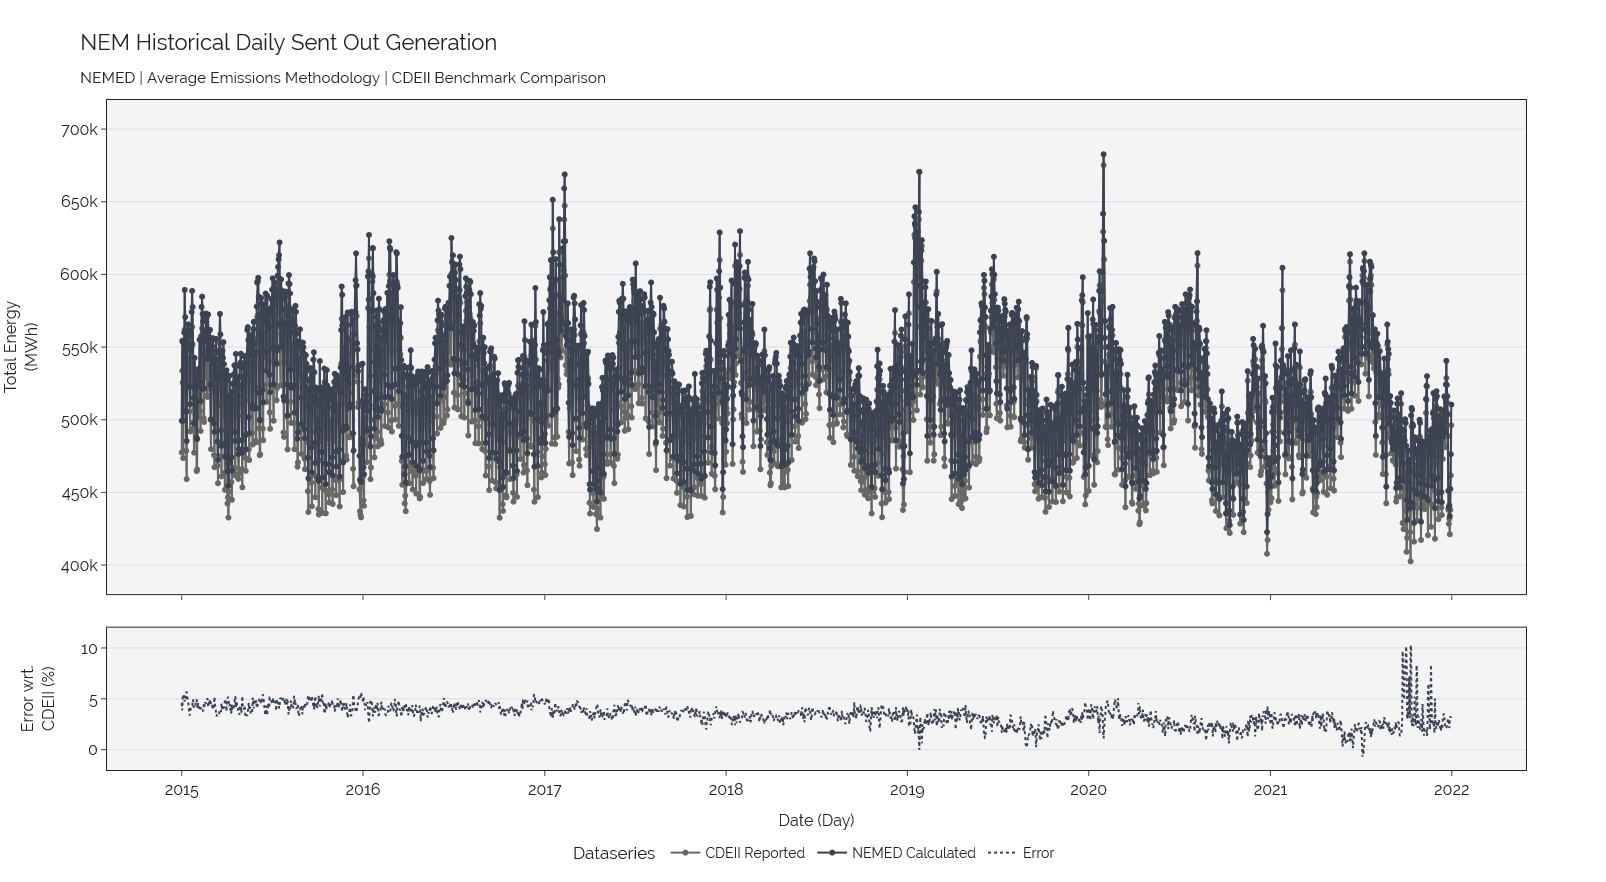
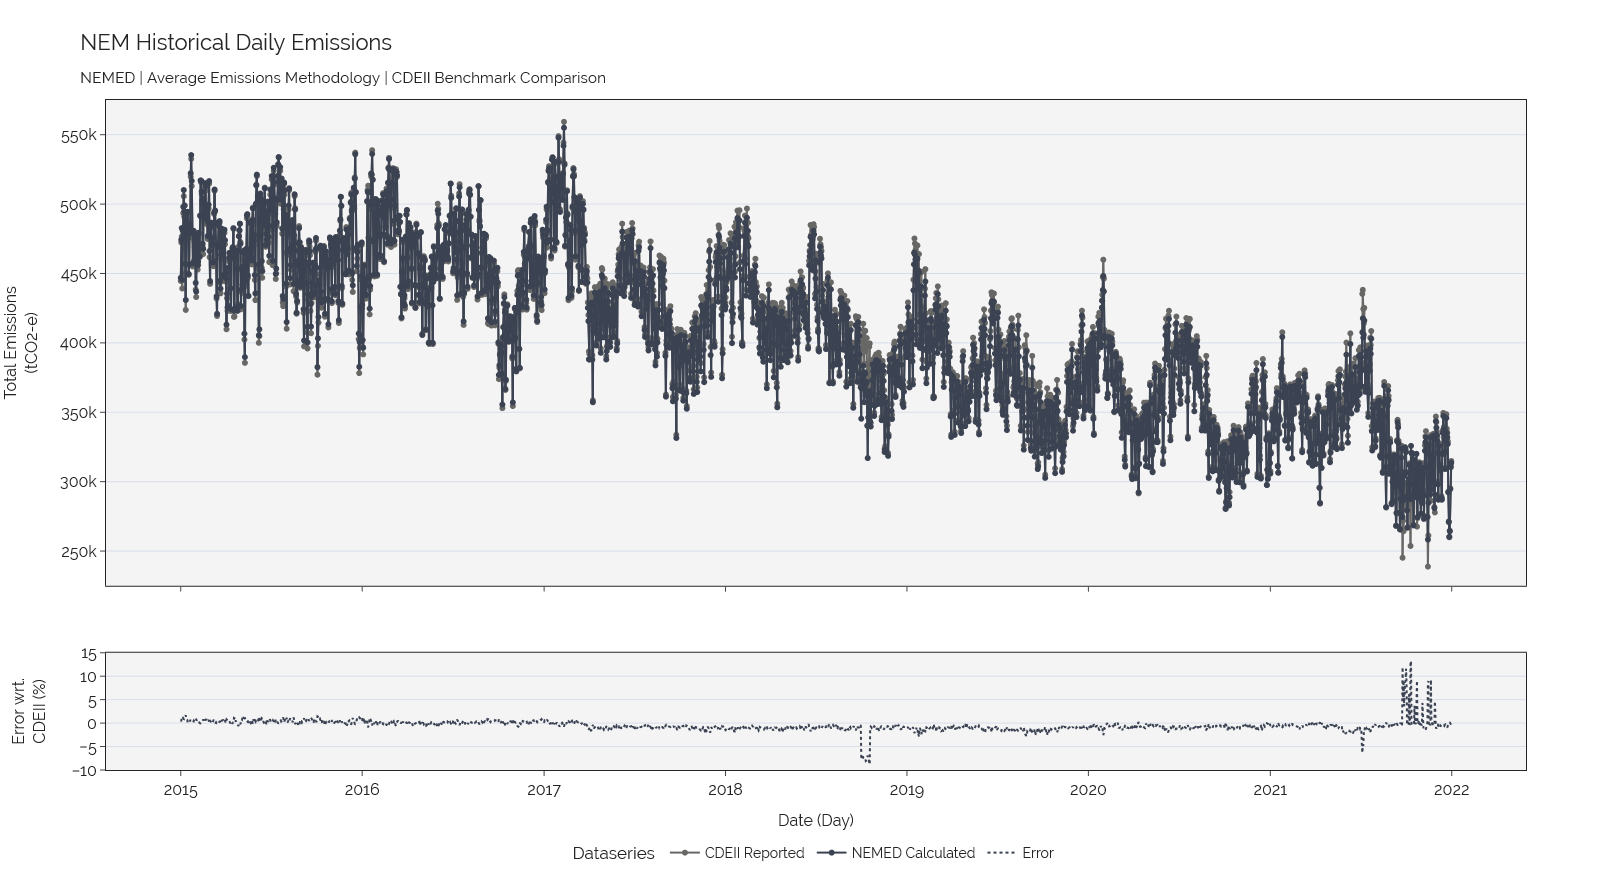
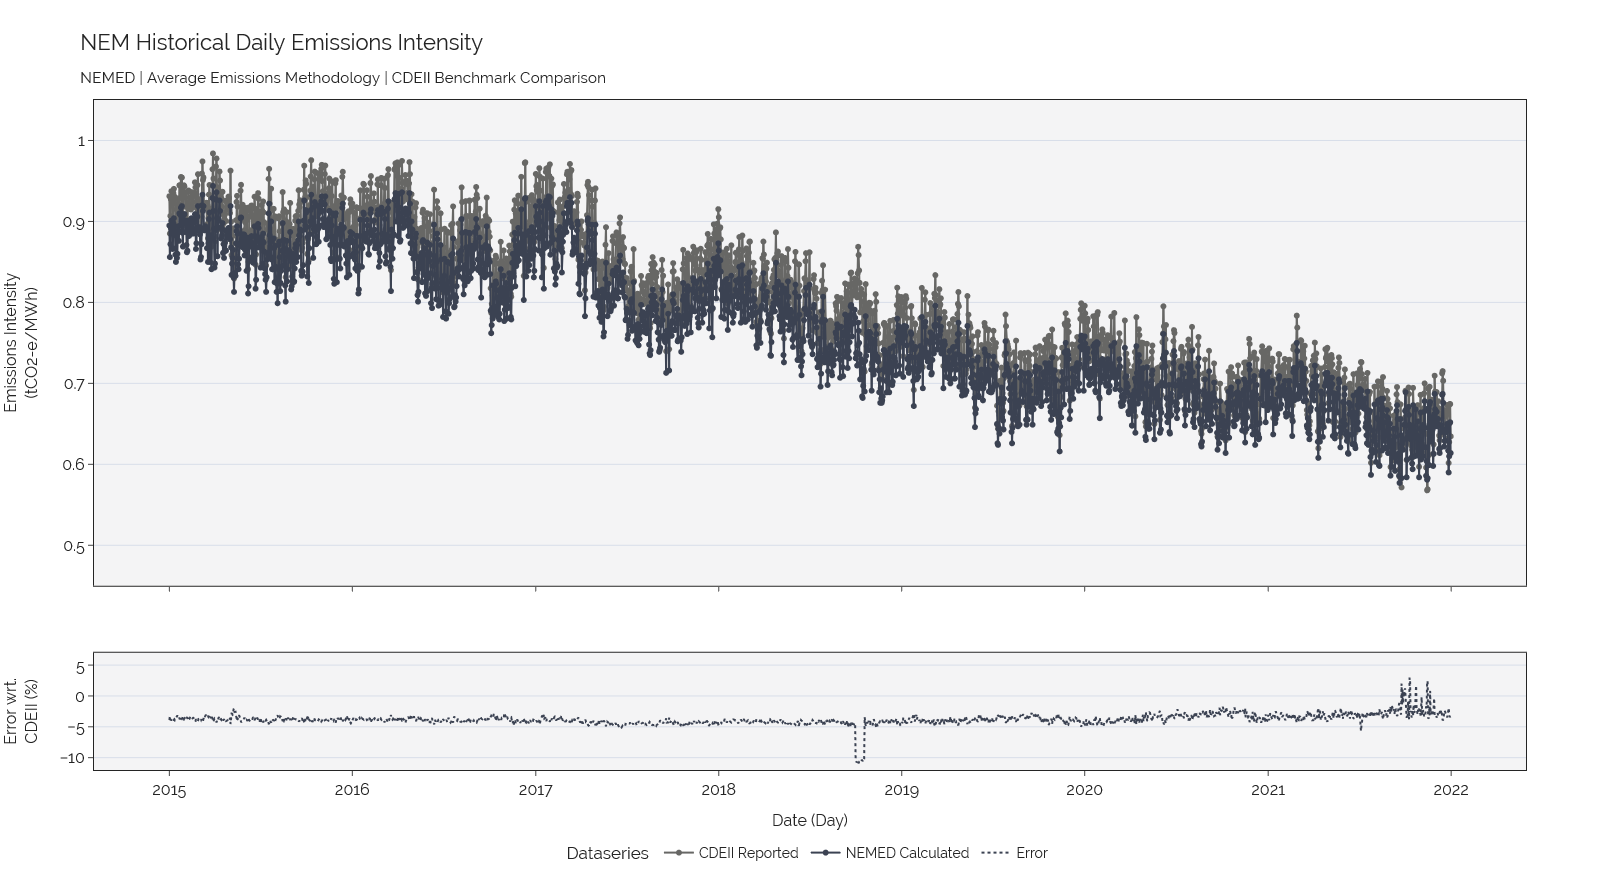
Overall the error is generally consistent with a few exceptions:
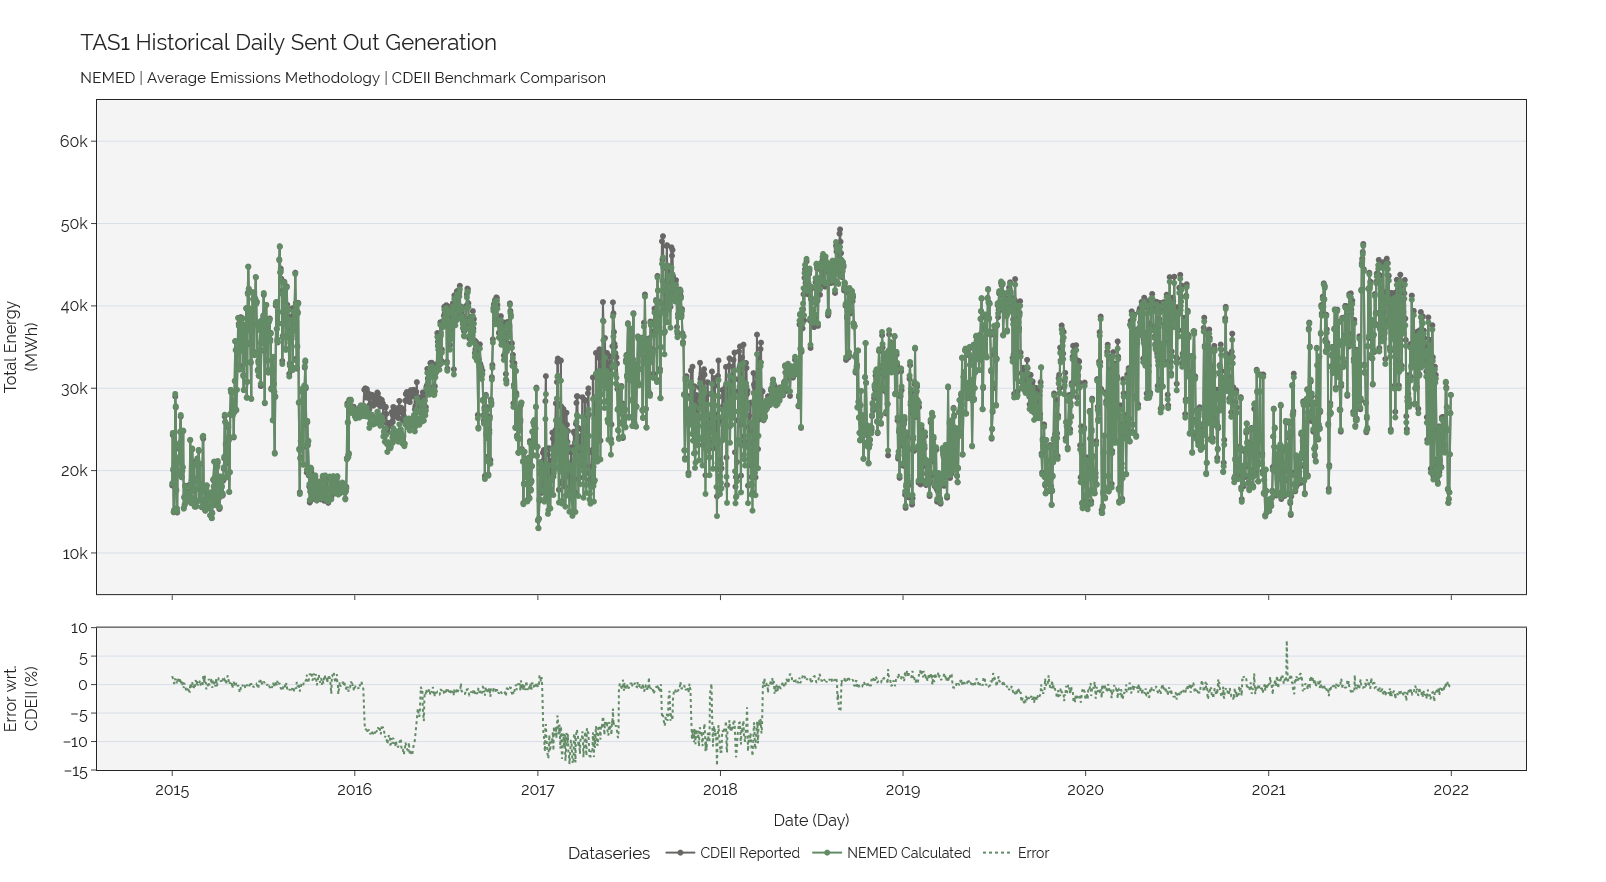
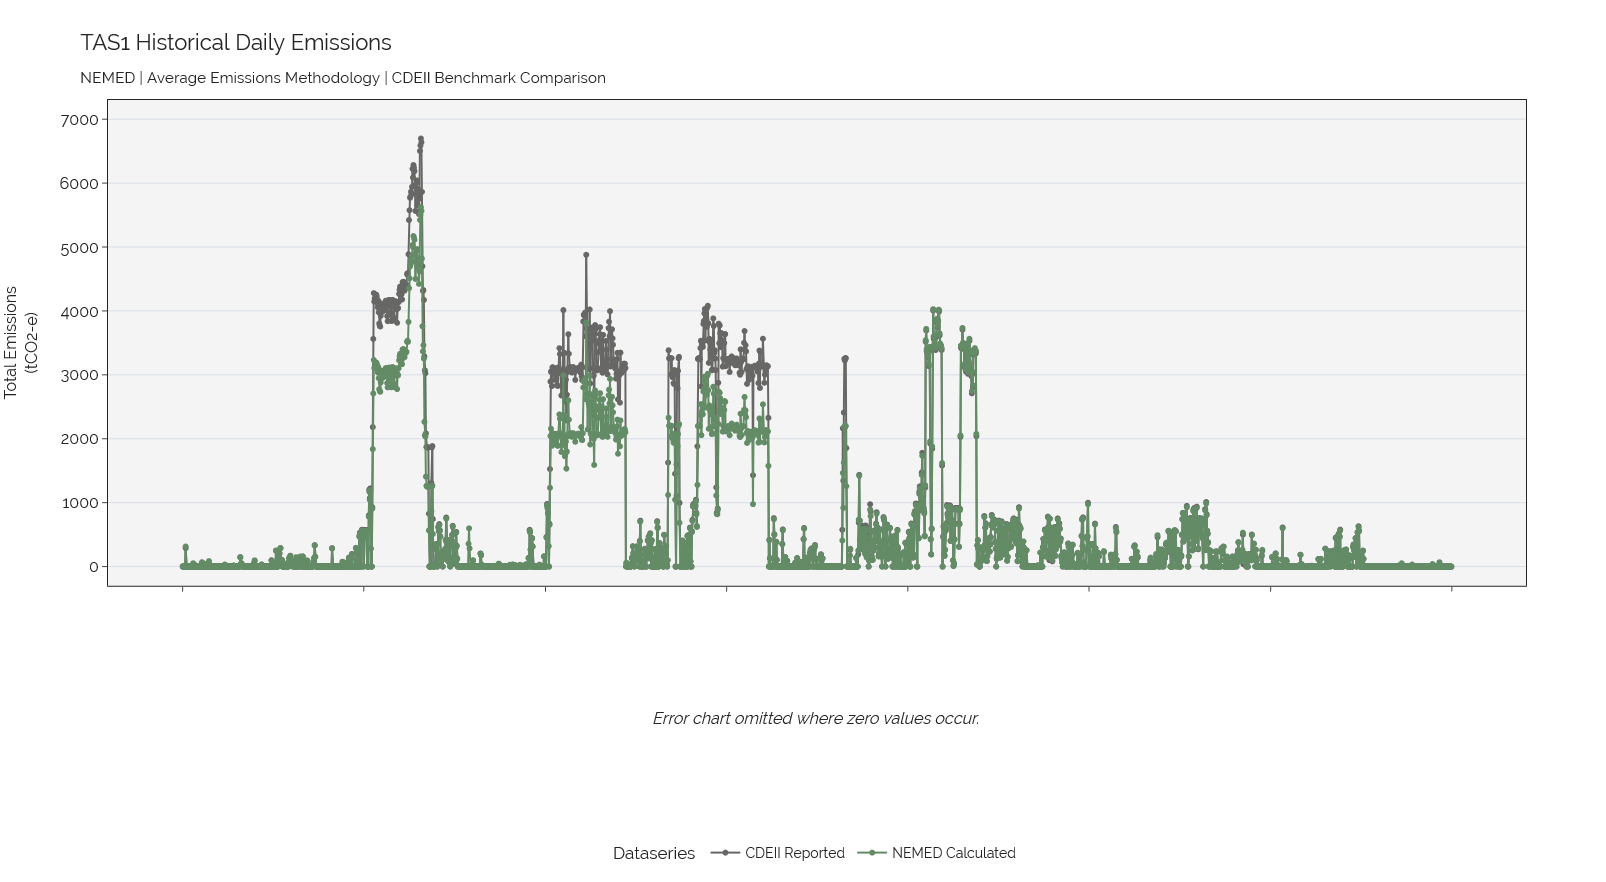
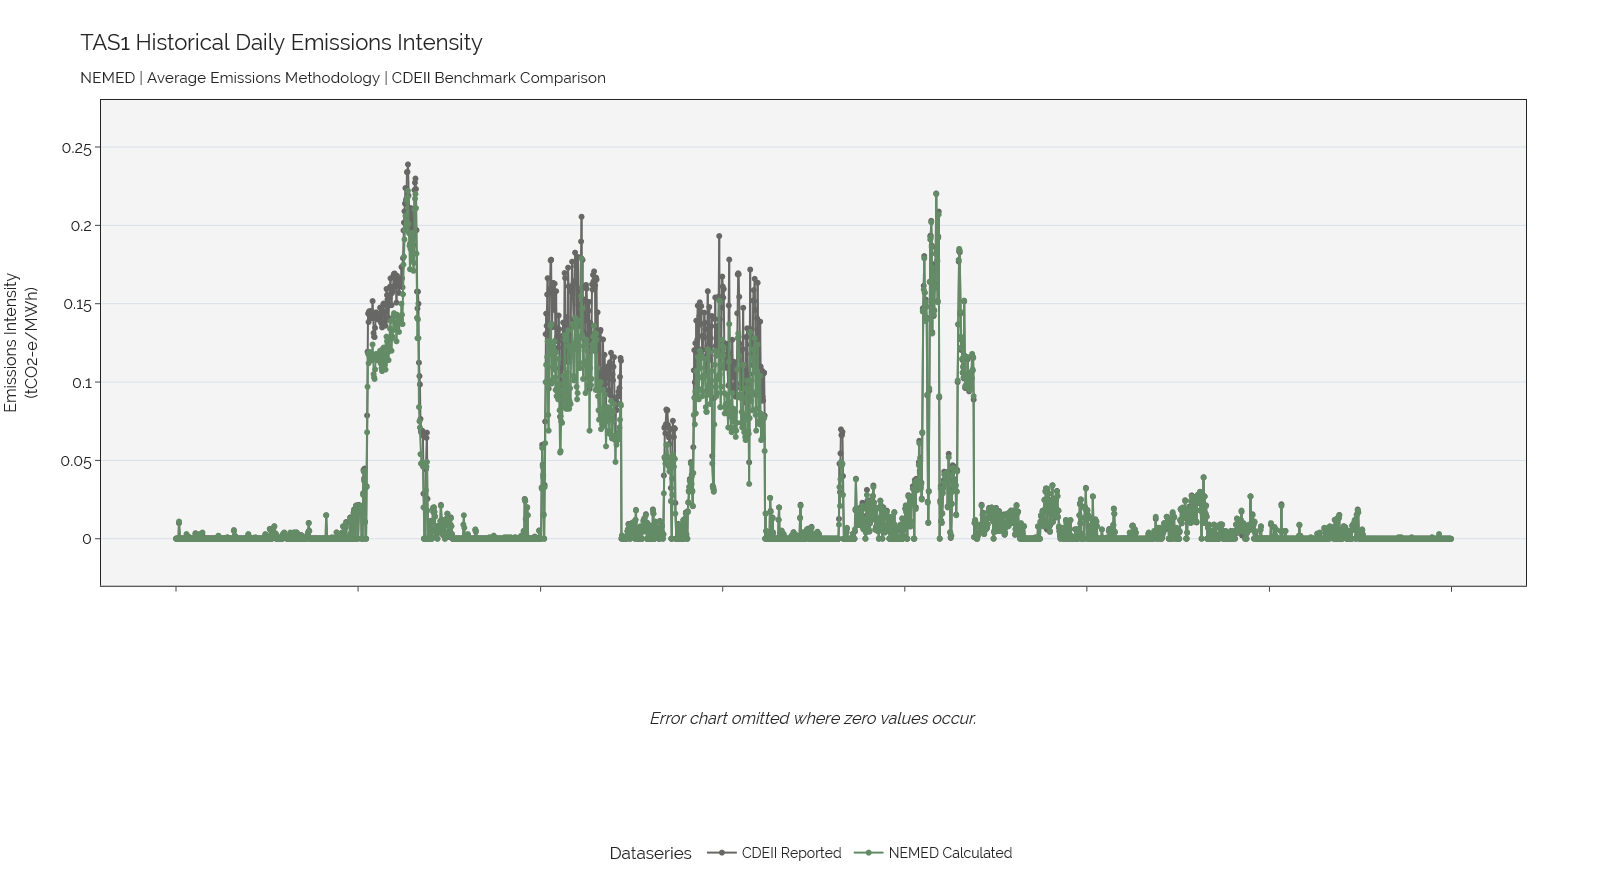
A few instances in Tasmania for 2016, ‘17, ‘18 where Sent-Out generation is underestimated, with error impacting subsequent metrics.
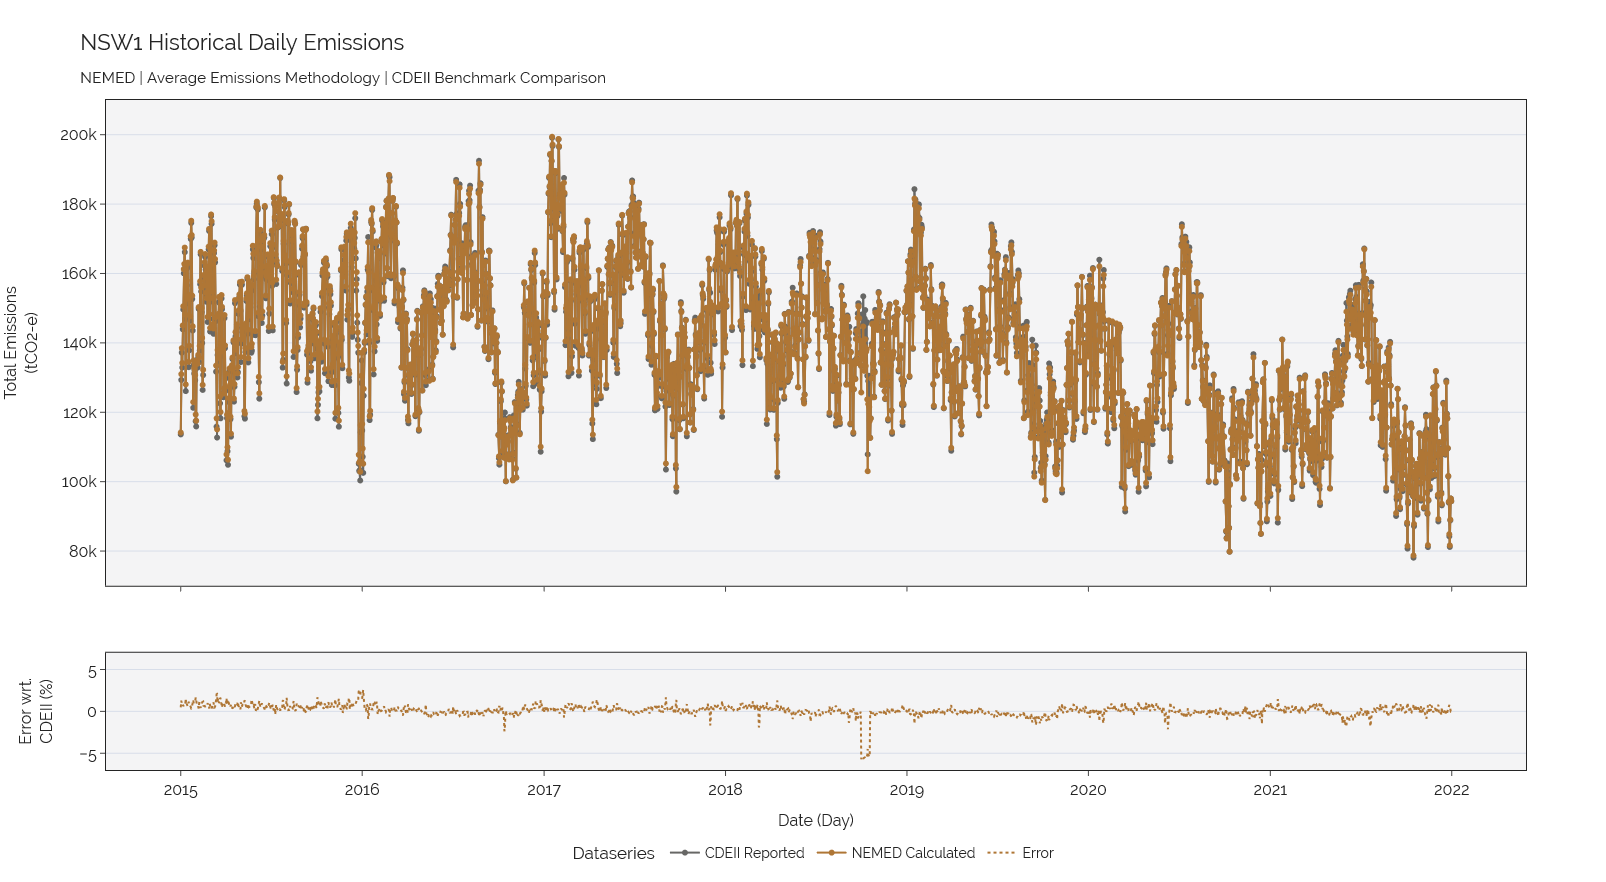
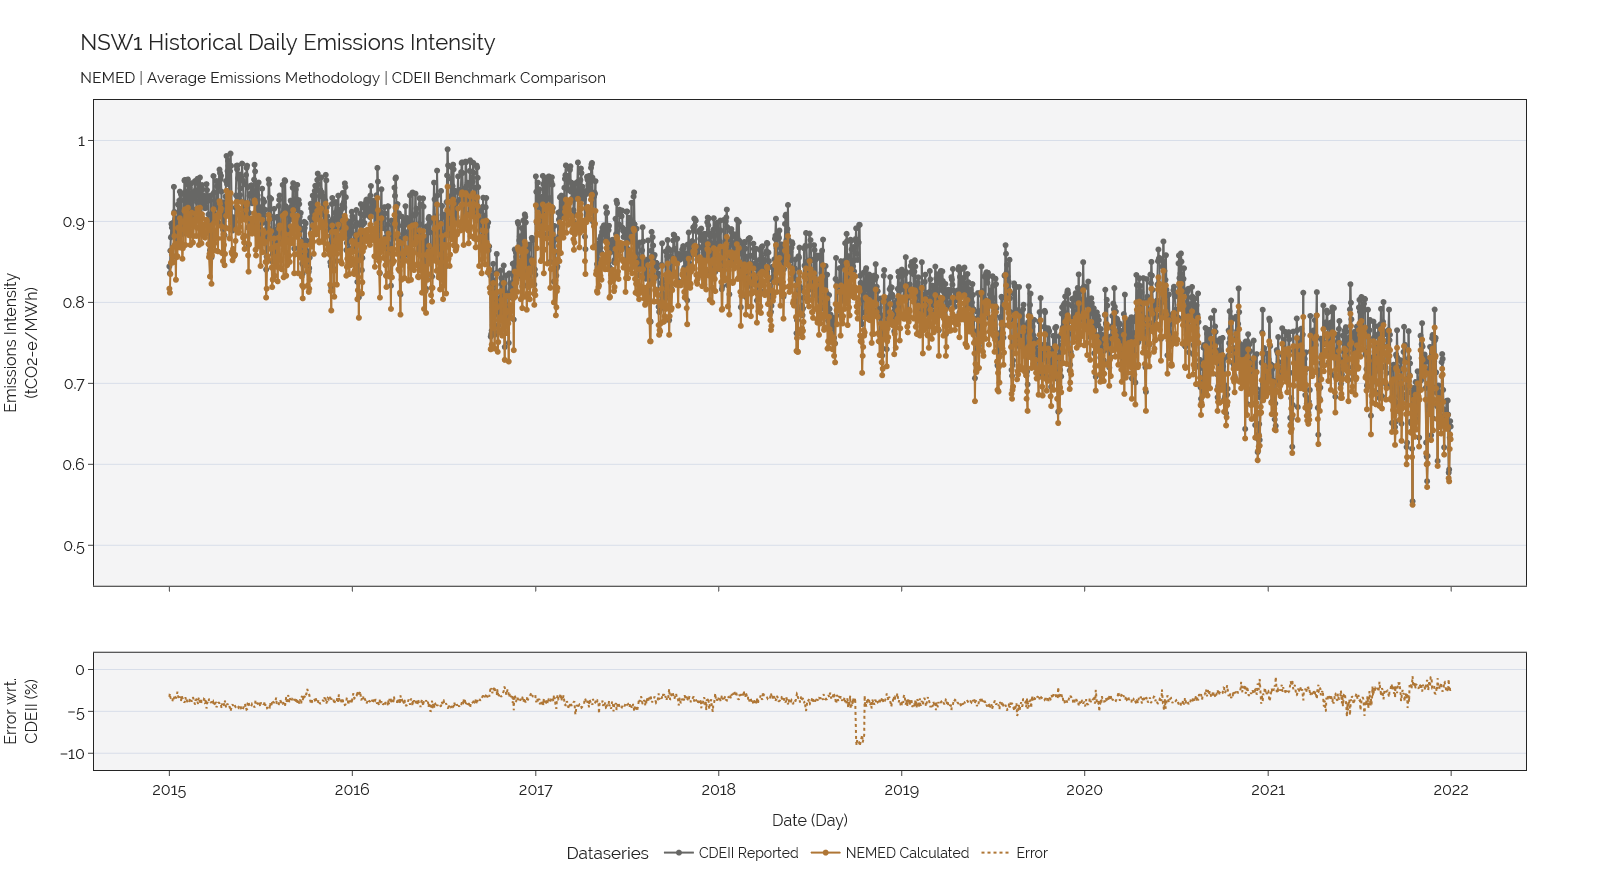
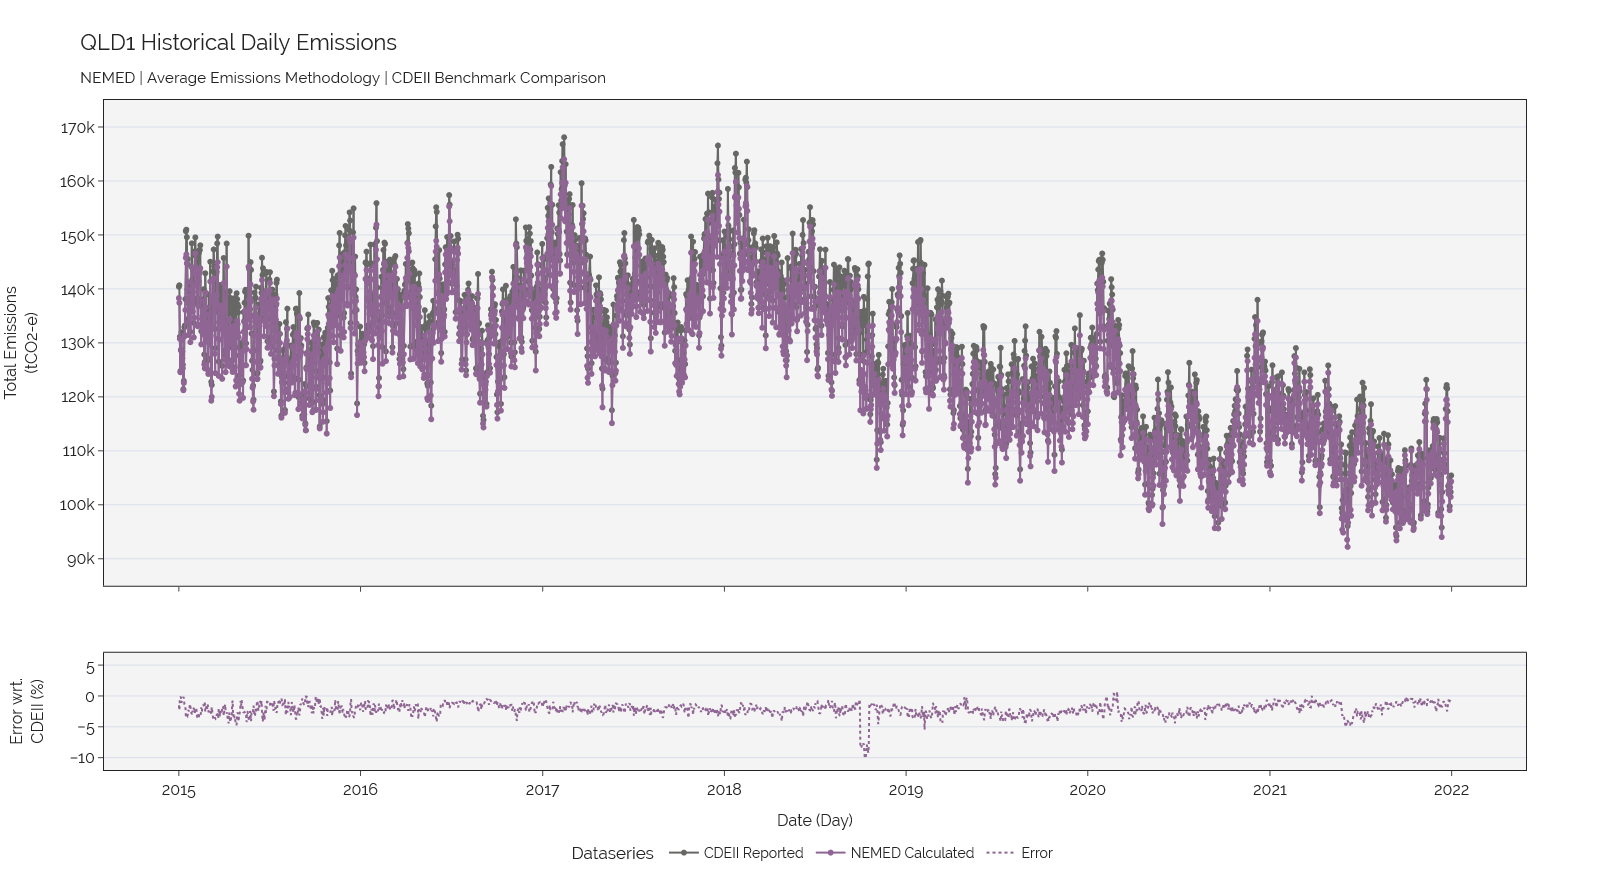
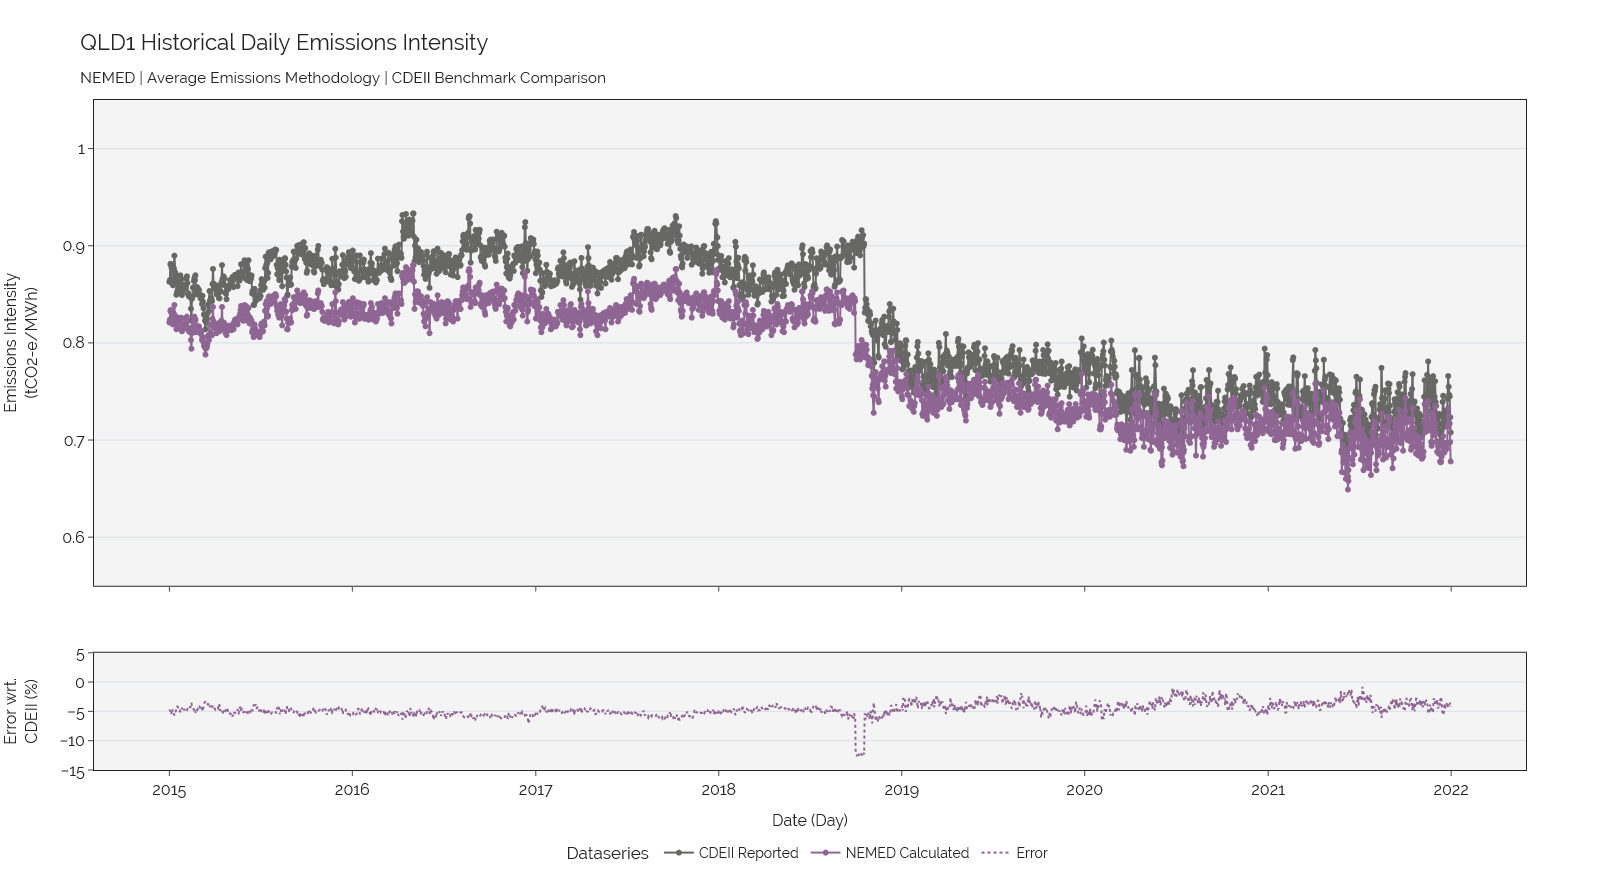
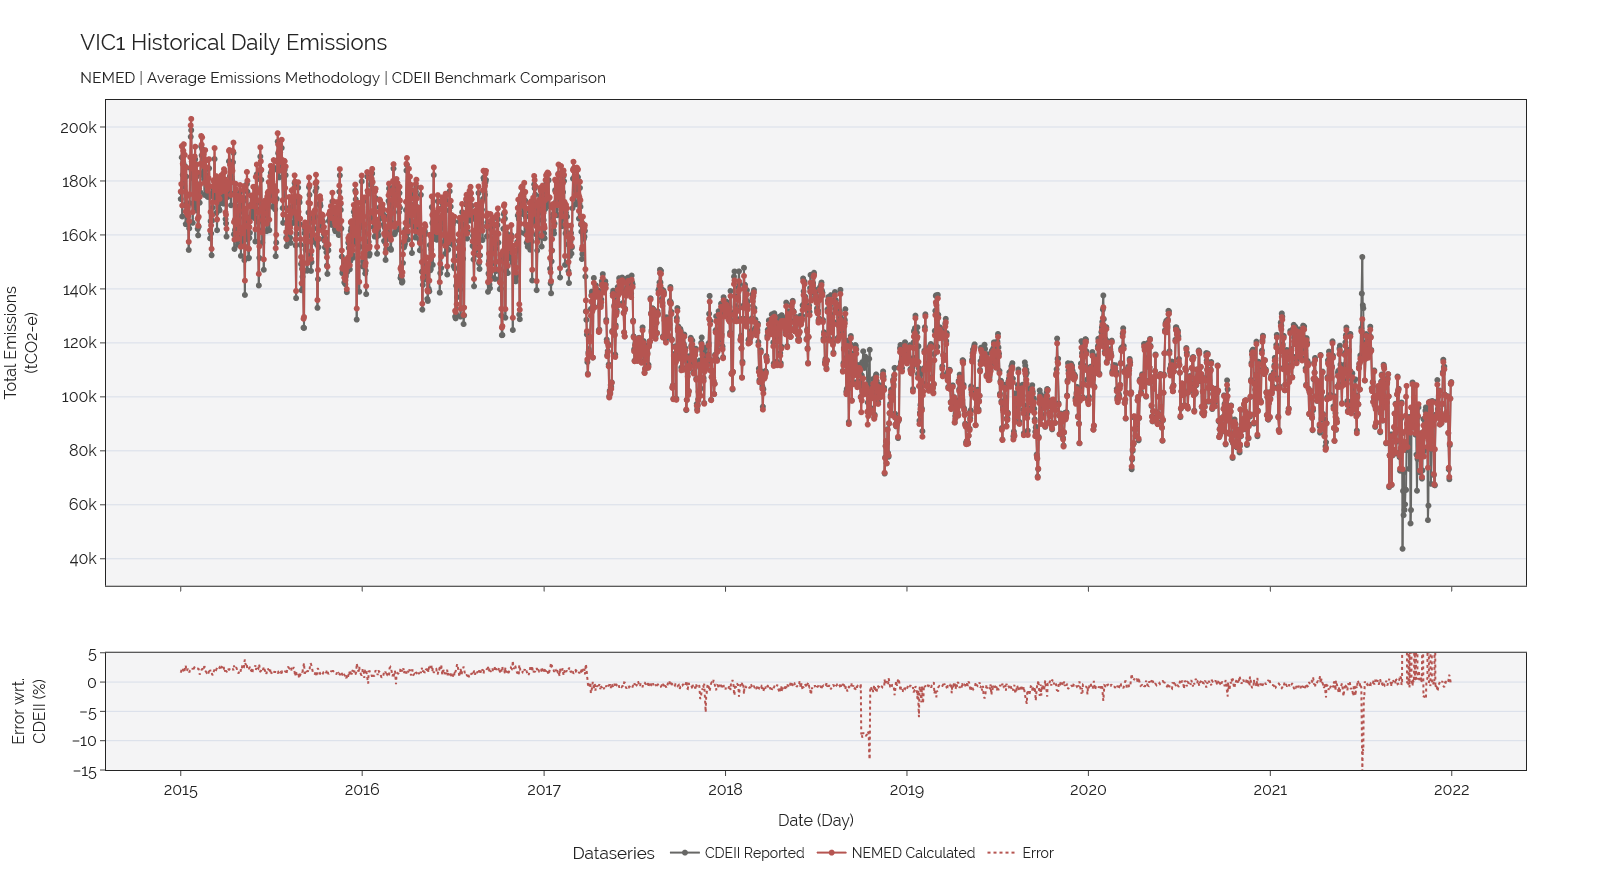
A short but quite low point (underestimation) in ‘18 for NSW1, QLD1, VIC1 in Total Emissions, also impacting Emissions Intensity.
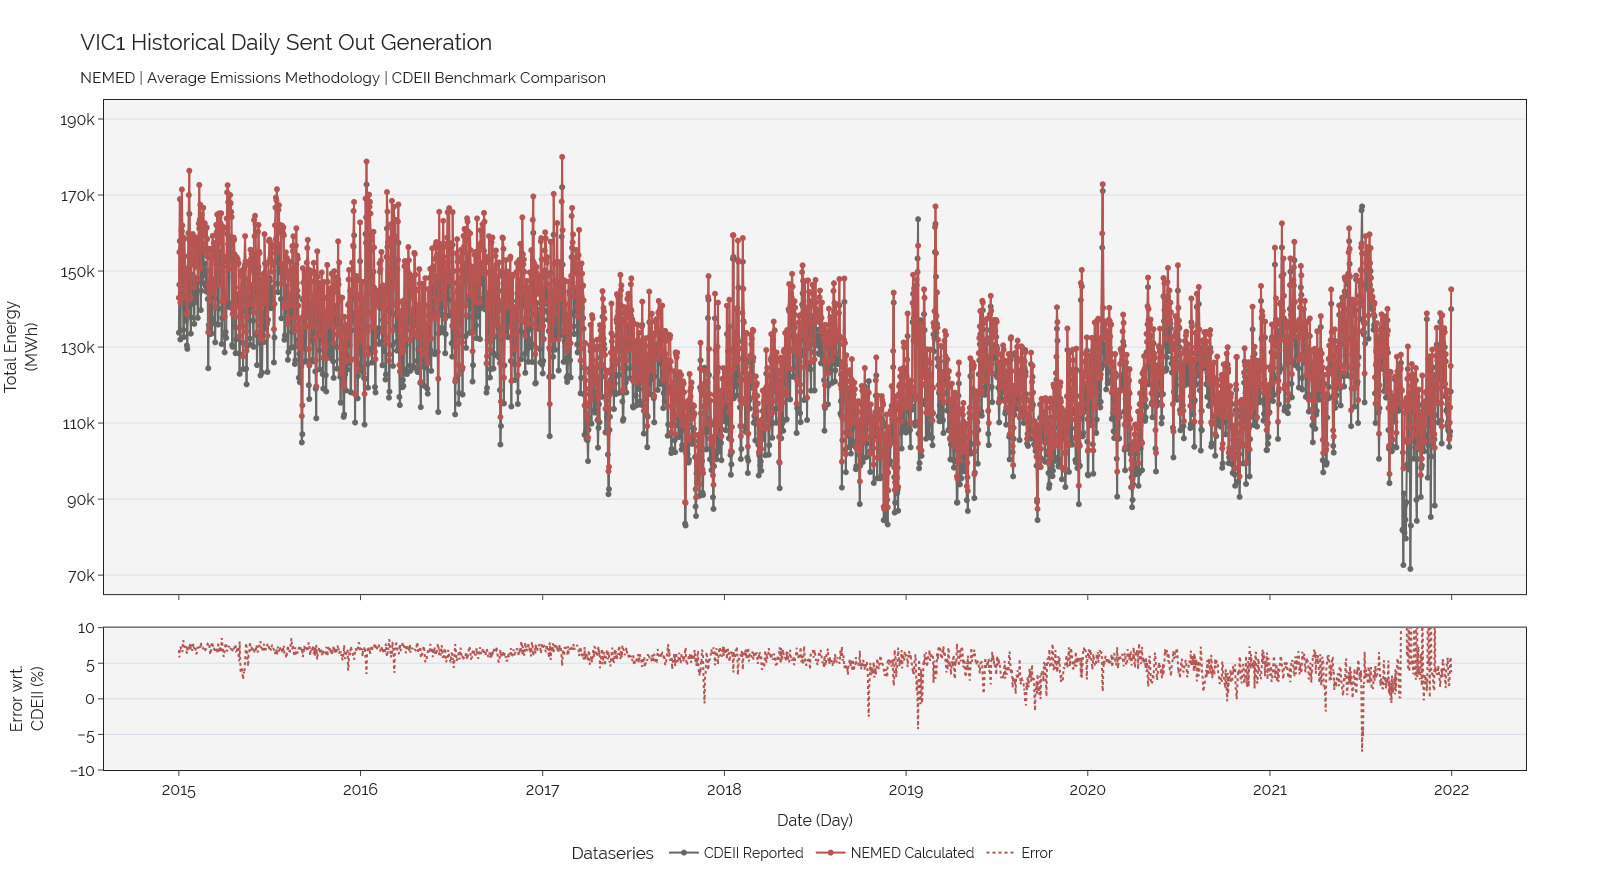
Substational issues with Victoria 2022 data for September-October which coincides with the market change from 30MS to 5MS. These later two discrepencies are of enough significance that they are clearly visible in the aggregated NEM traces.
All Interactive Plots
Click the images to open the plot as an interactive plotly
NEM#
Energy Sent-Out#
Total Emissions#
Emissions Intensity#
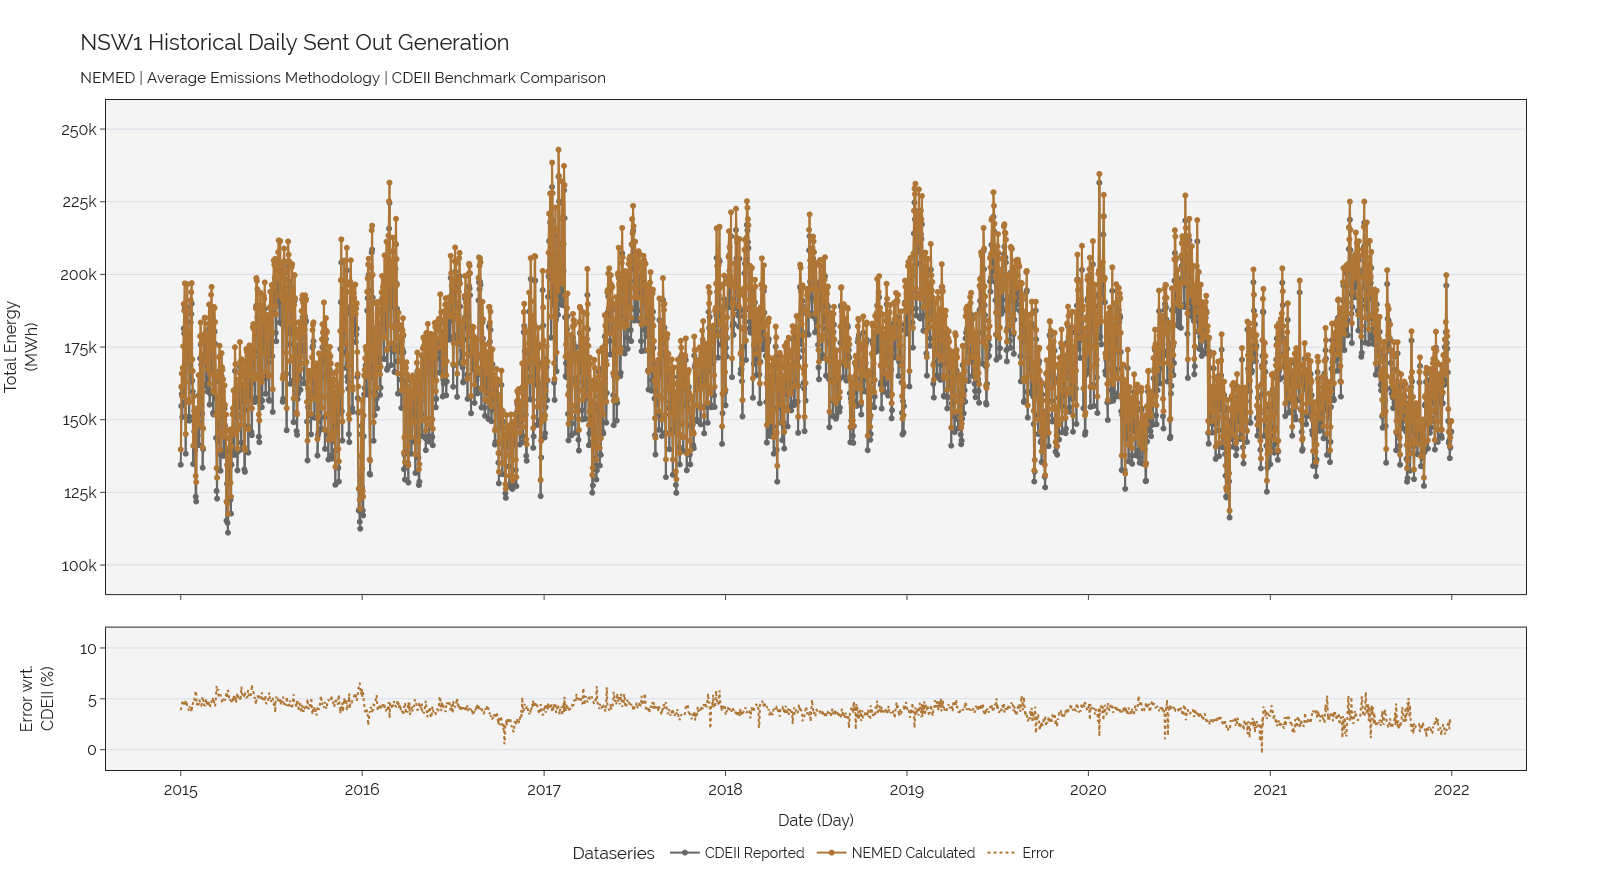
NSW1#
Energy Sent-Out#
Total Emissions#
Emissions Intensity#
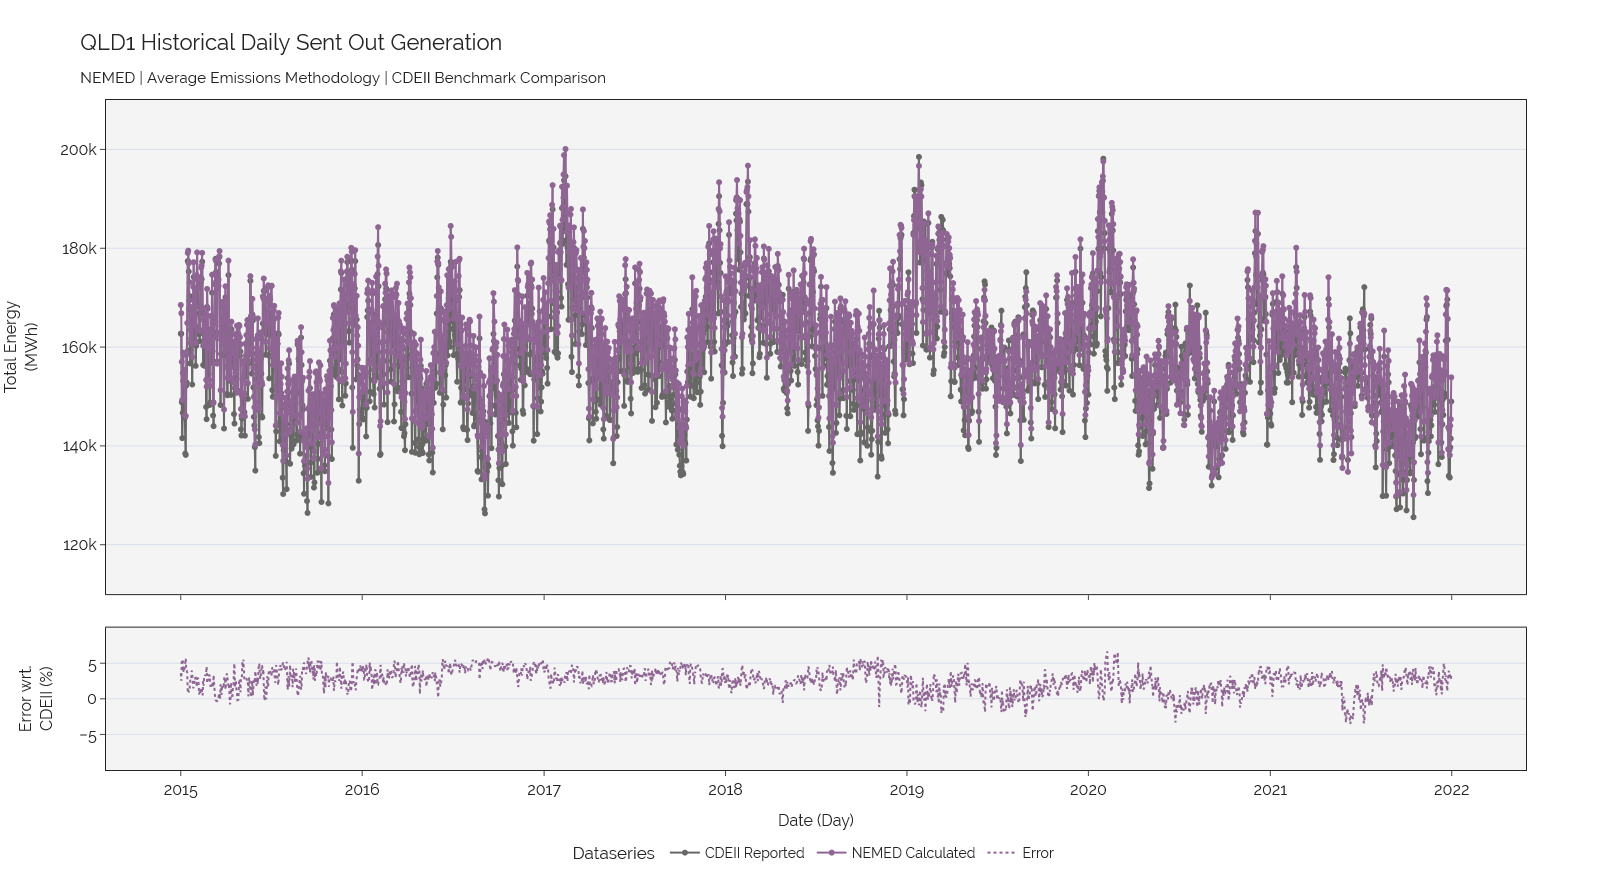
QLD1#
Energy Sent-Out#
Total Emissions#
Emissions Intensity#
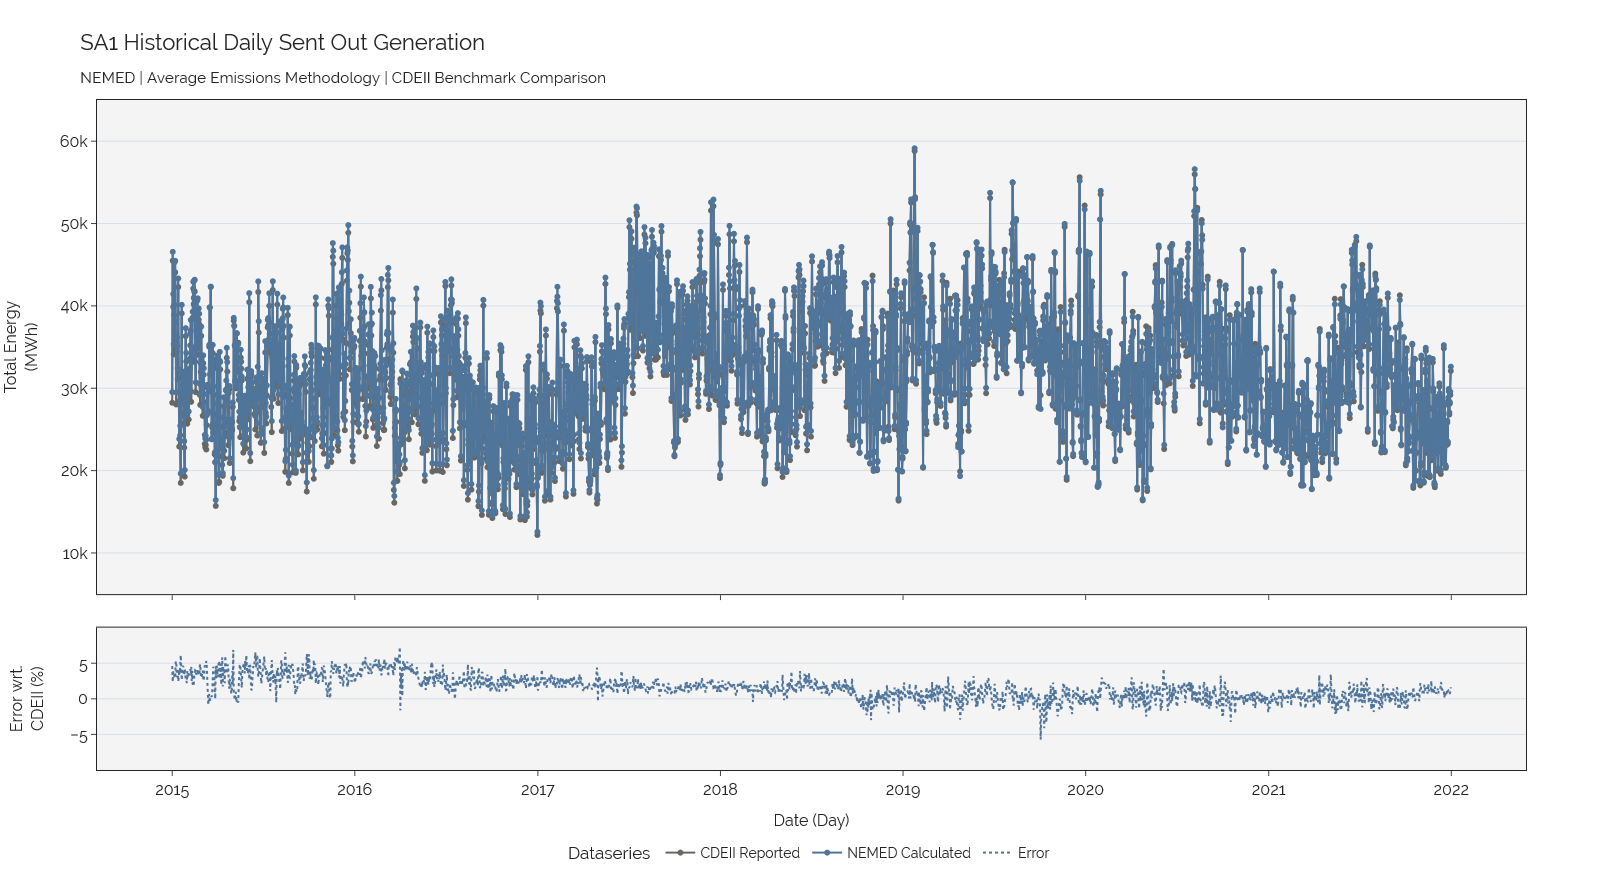
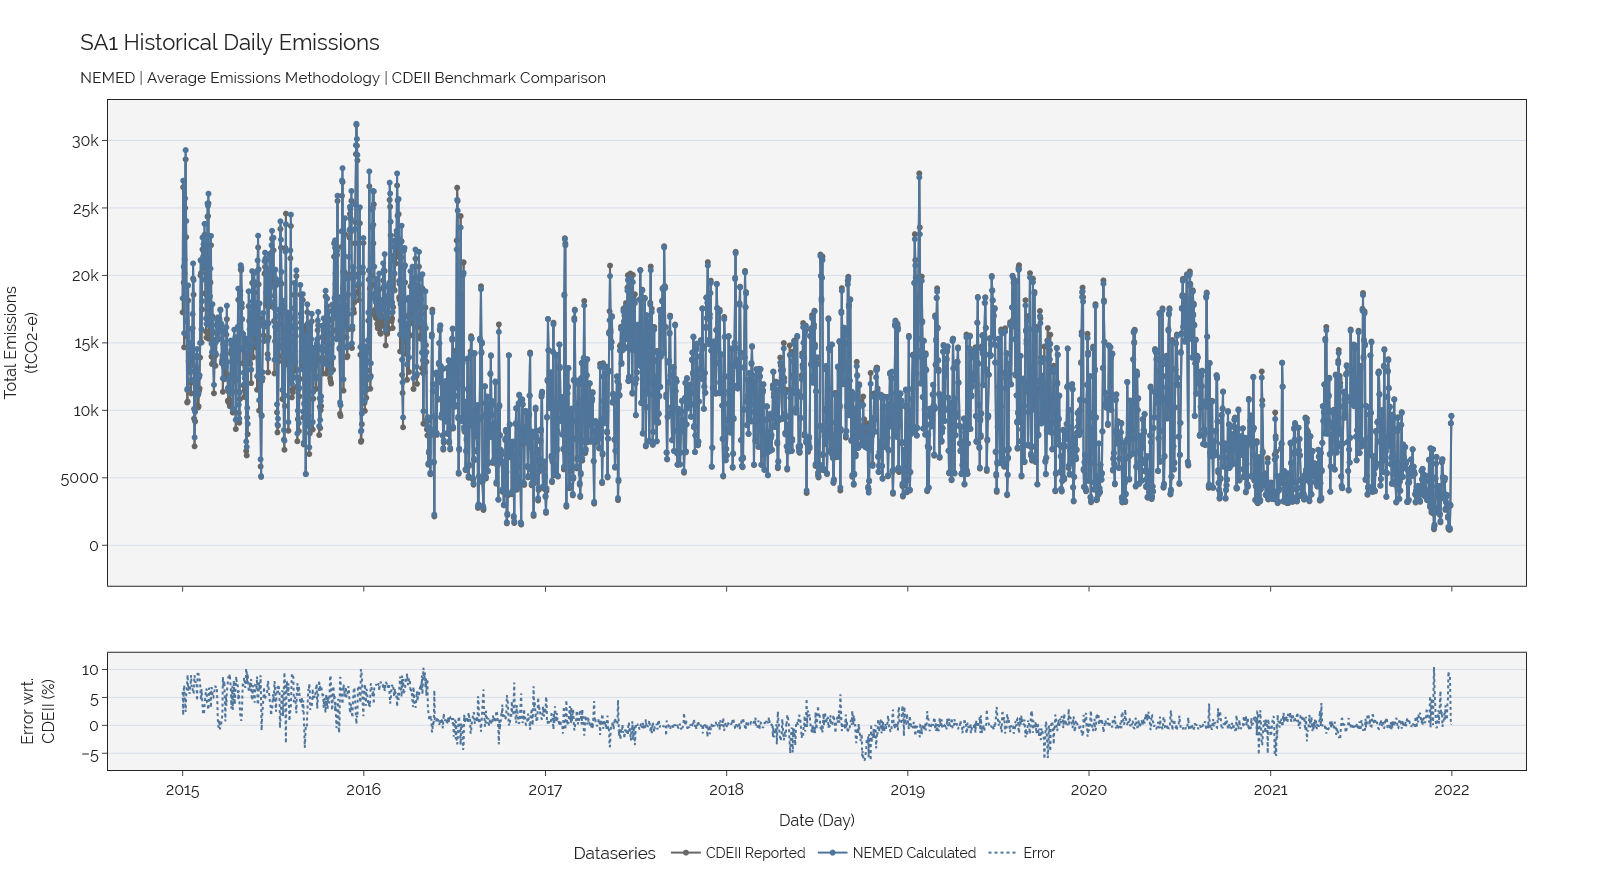
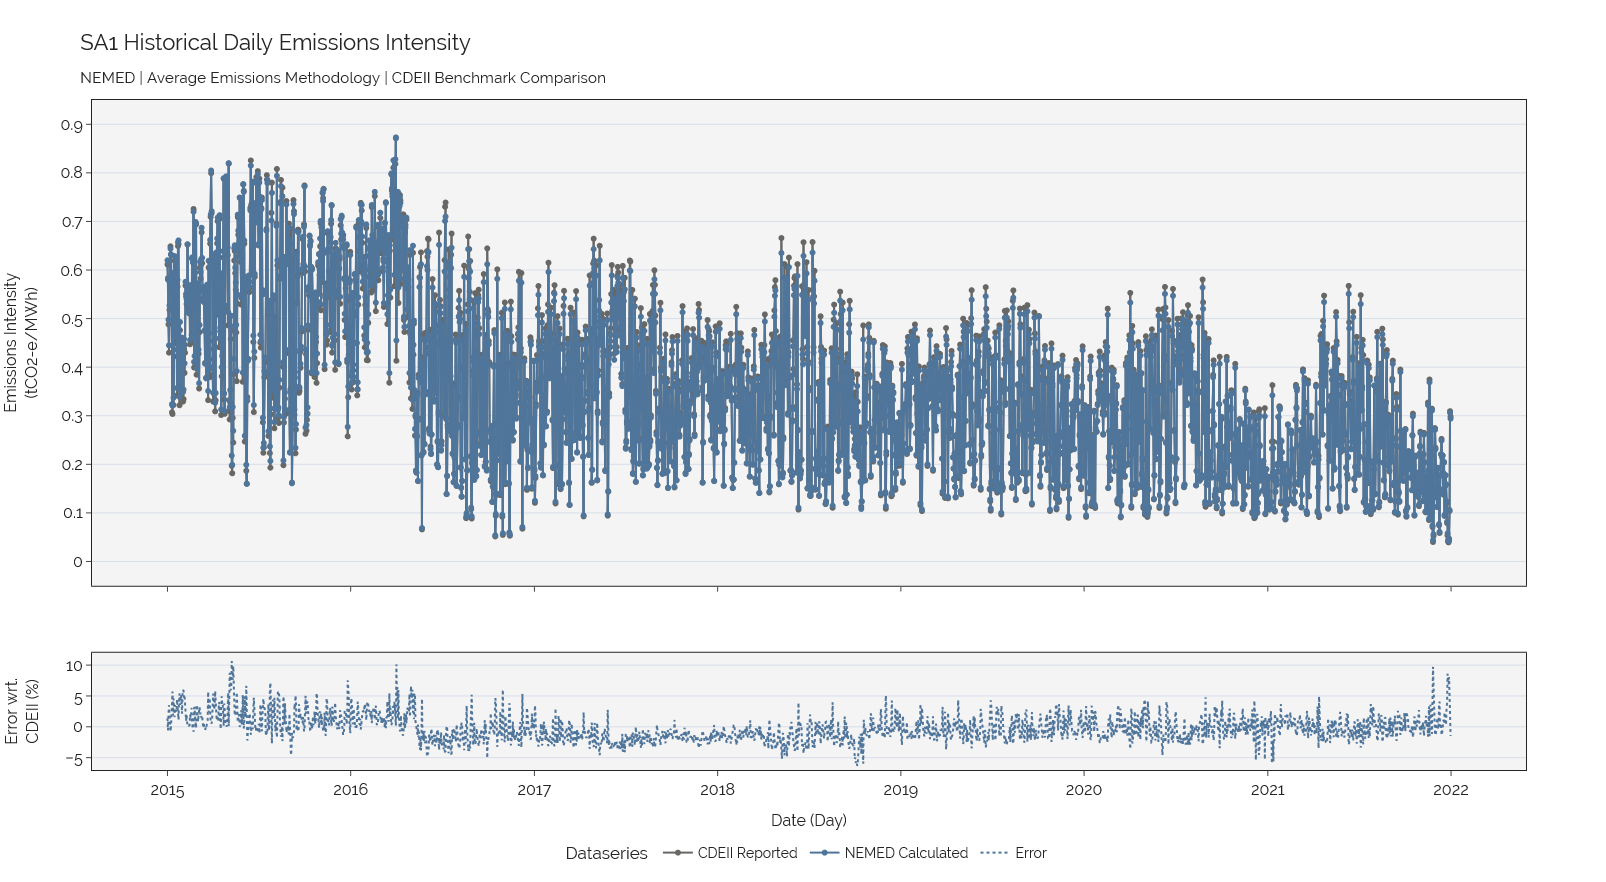
SA1#
Energy Sent-Out#
Total Emissions#
Emissions Intensity#
TAS1#
Energy Sent-Out#
Total Emissions#
Emissions Intensity#
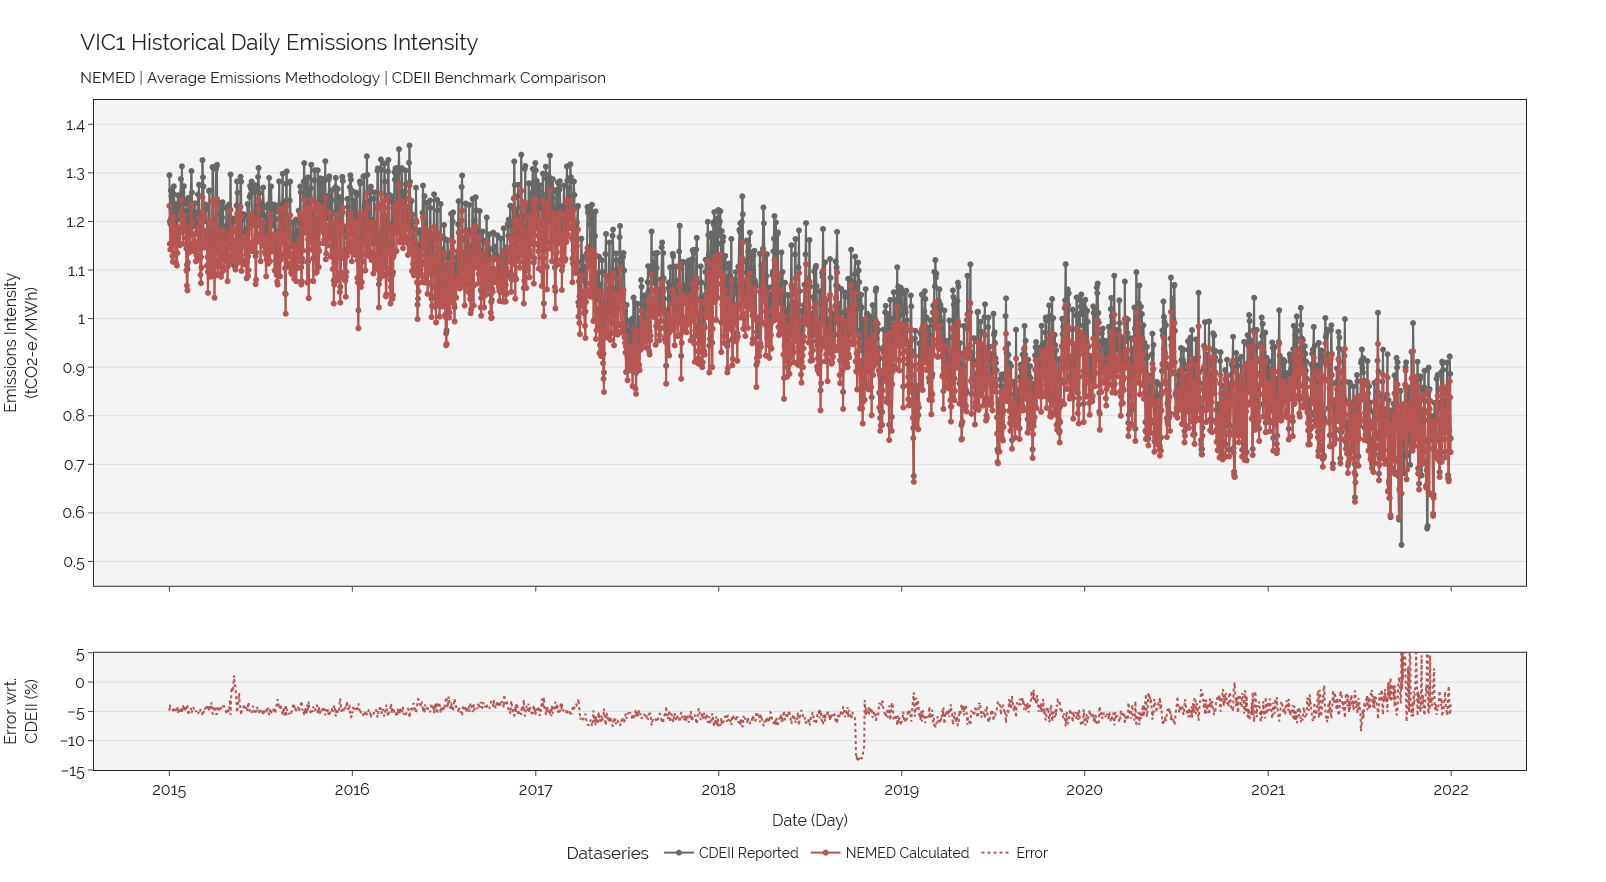
VIC1#
Note
It has been suggested there are data quality issues in CDEII database at Sep-Oct ‘21 upon change from 30MS to 5MS. Full error range has been clipped but can be viewed in interactive chart if desired.
Energy Sent-Out#
Total Emissions#
Emissions Intensity#